SignalDB
SignalDB is an observability database for traces, logs, metrics, and profiles. It ingests OpenTelemetry natively, serves Grafana-compatible query APIs (Tempo, Loki, Prometheus, Pyroscope), and ships its own built-in Explore UI — all from a single binary with a single data directory.
It is built to be easy to run in a homelab — one process, SQLite, local disk, bounded retention — with the option to scale out into separate services backed by PostgreSQL and S3 when you need it.
Where to start
- Send data — point an OpenTelemetry SDK or Collector at SignalDB: Sending OTLP data
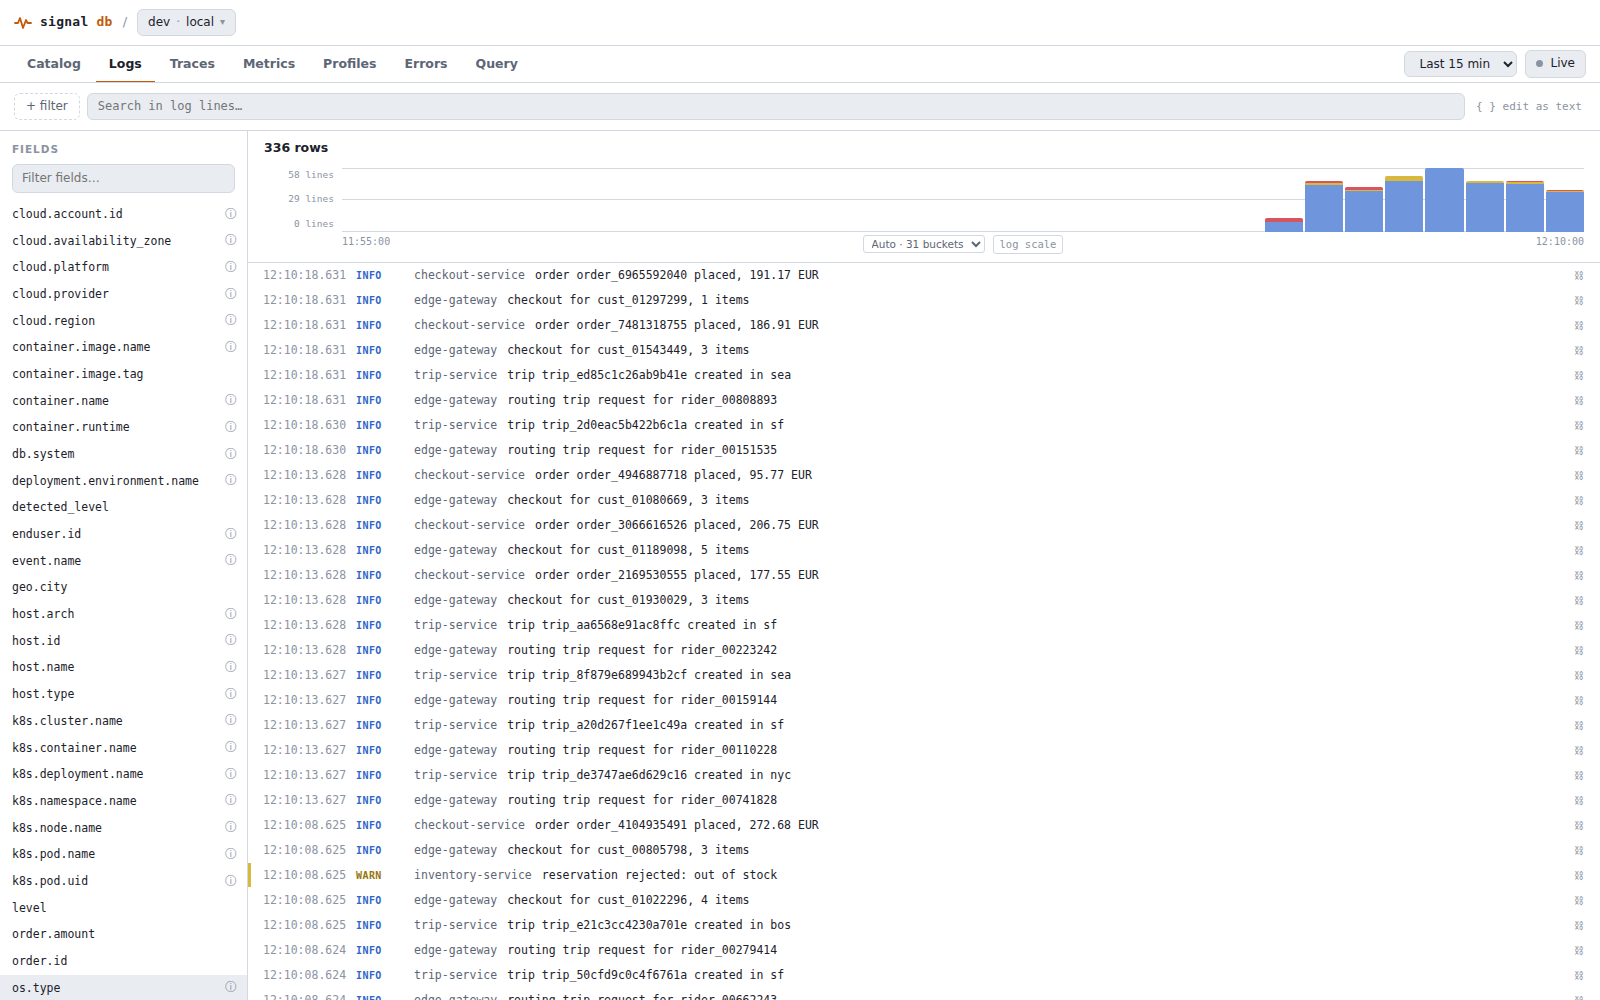
- Explore it — the built-in UI for logs, traces, and metrics: Explore UI
- Clients retry throttling for you — the SDK, CLI, MCP server, and UI
back off on
429the same way: Client retry - Use Grafana — connect via the Tempo/Loki/Prometheus-compatible APIs or the native plugin: Grafana datasource
- Run it — deployment, storage, WAL durability, retention: Operating SignalDB
The short version
flowchart LR
    OTLP[OTLP clients] --> A[Acceptor]
    A --> WAL[(WAL)]
    WAL --> W[Writer]
    W --> S[(Iceberg tables\nParquet on disk or S3)]
    G[Grafana / Explore UI] --> R[Router]
    R --> Q[Querier]
    Q --> S
In monolithic mode all of these run inside one signaldb process. In
microservices mode each box is its own binary — same code, same
storage format. See the architecture overview
for how the pieces fit together.
Project status
SignalDB is under active development. Trace storage and the Tempo-compatible API are the most mature surface; LogQL and PromQL support cover most of each language with remaining gaps tracked on GitHub. Interfaces and storage layout may still change between releases.