Explore UI
SignalDB ships a built-in explore UI for the service catalog, logs, traces,
metrics, profiles, and errors, plus a native Query IR tab,
served by the router at its root (http://<router>:3000/, as a SPA
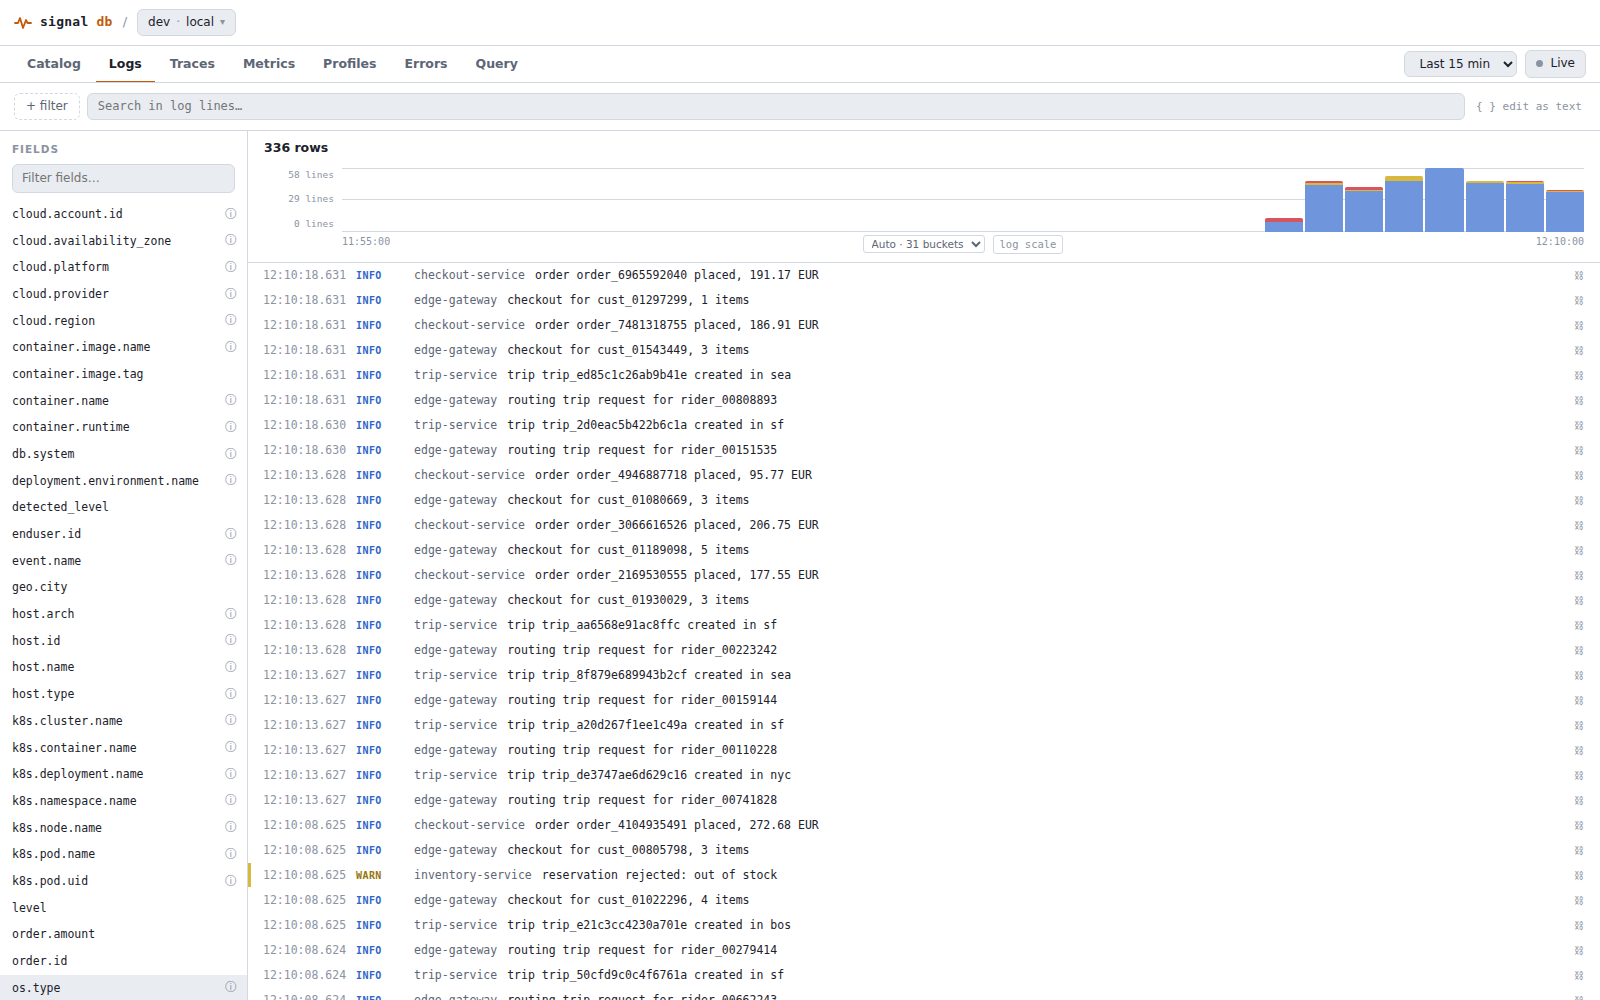
fallback behind the API routes). The logs tab reads rows, its volume
histogram, and its field/value pickers through the Query IR — the field
sidebar and the add-filter chip's key/value boxes come from the IR's
describe stage (Discovery),
not the Loki-compatible API, so a bookmarked URL from before this only
resolves its two Loki-spelled chips (level, service_name) to their IR
equivalents (severity_text, service.name) on load. The traces tab's facet
key picker is likewise describe: fields on traces, replacing the Tempo
tag-name endpoint, and trace search itself (the list, the group table, the
volume chart) is a Query IR read on traces — root spans, filtered by the
same where tree the facet chips compile to. The metrics builder's metric,
label, and value pickers are describe: metricNames/fields/values on
metrics, with per-label cardinality read off the field's own
cardinality estimate; running the query itself is a Query IR read too —
every builder row, including rate/increase and multi-query formulas,
compiles to the IR rather than PromQL (see Building metric
queries). The profiles tab's
type/service/attribute pickers are Query IR discovery too: profile types are
an aggregate by sample/period type and unit on profiles, services and
attribute keys/values are describe: fields/values. Any describe:
values answer that isn't a free, exact, declared set (a statistics sketch
or a sampled scan) is marked "partial list" in the picker. It also hosts the OAuth
connector consent screen at /oauth/consent (see MCP).
What it does
- Overview — the landing page (
/,/overview): system-wide KPIs, deploys, the service map, every service's health, ingest per signal, the top error groups and the slowest endpoints, scoped to one environment and the selected window. See The overview. - Catalog — a service/infrastructure catalog discovered by querying the ingested telemetry for OTel semantic-convention resource attributes, not from a fixed inventory. The service entity type offers a List | Map switch, the Map drawing the tenant's whole service graph; a service's own page carries a one-hop neighbourhood map next to its dependency breakdown. See The catalog.
- Logs — filter chips compiled to a Query IR
wherepredicate tree, a per-severity volume histogram (an IRaggregateonseverity_textwithstep), a virtualized log list with per-attribute filter/exclude actions, a fields sidebar, and live tail (the same IR queries, polled). There is no raw-query editor for logs — the Query IR tab is the text escape hatch. The add-filter key box suggests schema-registry keys; picking a registry key filters on that key as spelled, dots included, and a hand-typed key that is not a valid label name (letters, digits,_and.) disables Add with an inline hint rather than failing silently. An expanded row stays expanded while live tail prepends newer lines. The expanded row shows the log's resource, scope, and log attributes as separate groups, matching how the IR keeps those OTel scopes apart — the same key can appear in more than one group. - Traces — a facet sidebar and a span-volume chart stacked by span status
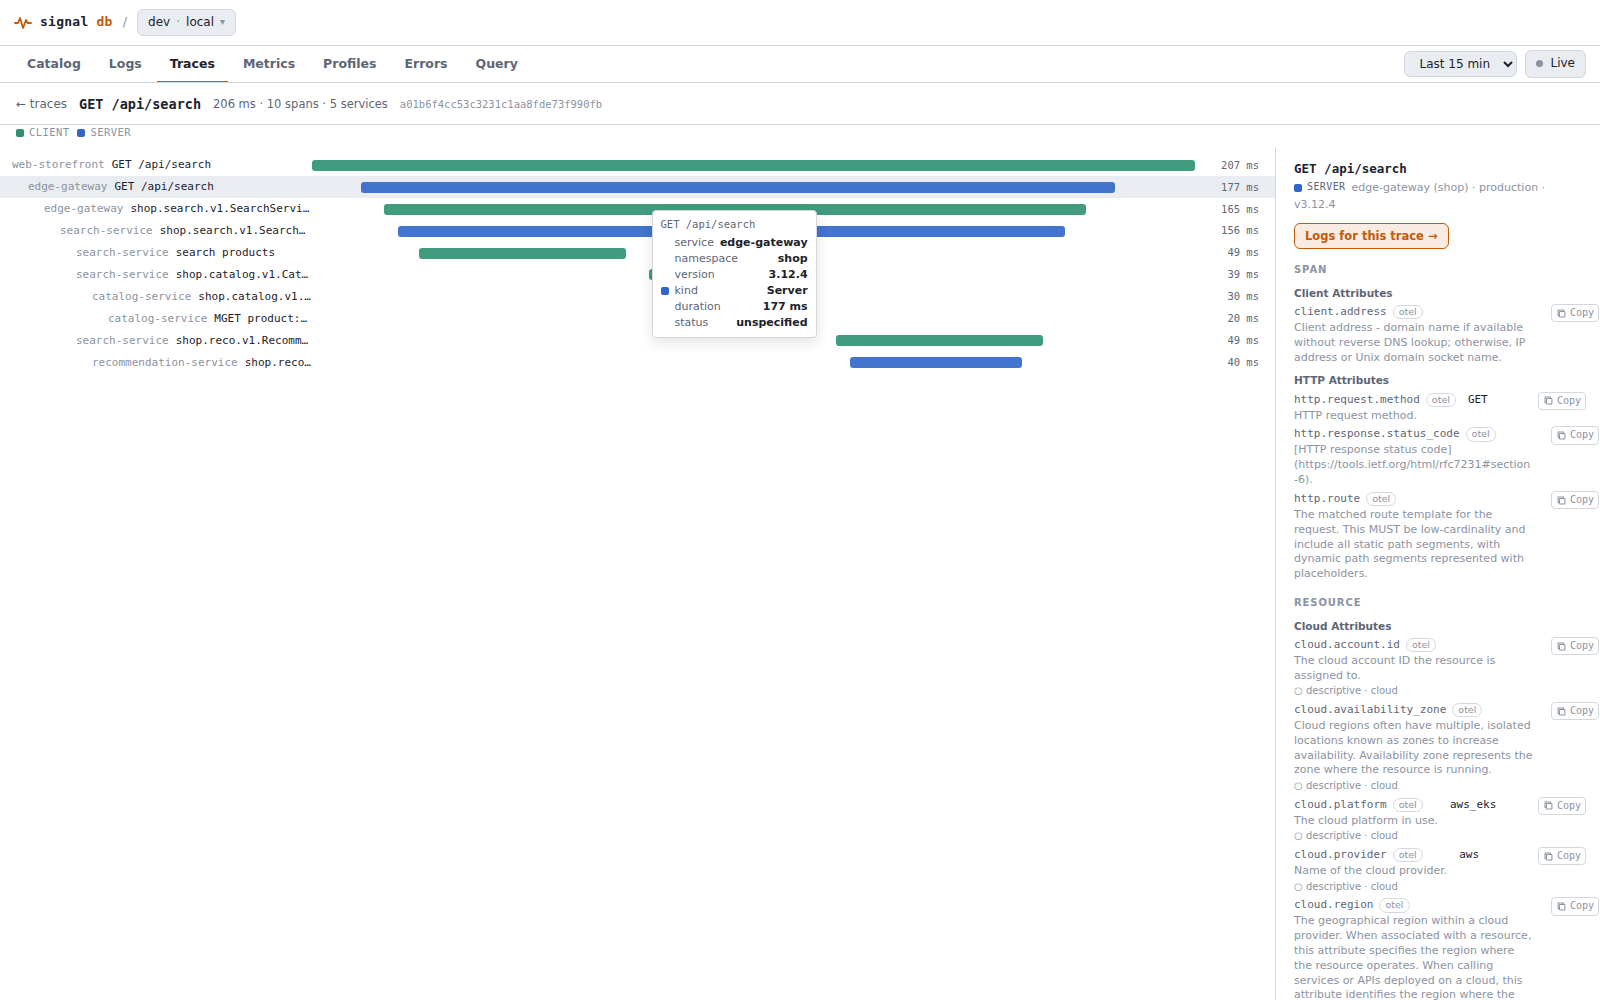
sit above a group-first view: recent traces arrive grouped by root
span name (or by service, any observed root-span/resource attribute, or
two dimensions combined via "Then by"), with per-group trace count,
request rate, error rate, p50/p95 latency, and last-seen columns —
all sortable. Error rates are grey below 0.5%, amber from 0.5% and red
from 2%, the same thresholds as the Catalog and the Overview. An Errors only checkbox at the top of the facet sidebar
narrows groups, list, volume chart, and facet counts to traces whose root
span has an error status (it is the
status = Errorfacet filter as a one-click toggle). Drilling into a group applies the same dimension-value filter to the span-volume chart as to its member list, so the chart above the list describes that group's spans, not the whole tab. The span.kind facet always lists all five kinds as checkboxes with their counts (a dash and "Could not load counts" when the count query fails, never a row of zeros), several can be on at once (oneinfilter), and Server, Client, Producer, and Consumer are selected by default — Internal spans are opted into; unchecking the last kind selects them all. Root spans are what the default Traces grain already inspects. Facets with a selection sit at the top of the sidebar and start expanded (collapse them by hand); the rest follow, collapsed, in their curated order. Selecting a group lists just its traces — each with its status as a coloured chip (error / ok / unset), sortable with errors first; duplicate trace ids in the response (a backend data issue) are deduped to the first occurrence, so a repeat doesn't scramble the sort; selecting a trace opens a waterfall with span details and error highlighting. A time ruler above the bars marks 0, ¼, ½, ¾, and the total trace duration (0, ½, and the total at phone width). A parent span that recorded no duration (an un-ended root, for instance) is drawn as a dashed outline over its child spans instead of a sliver; its own duration still reads as recorded. Clicking a span row or bar selects it and opens its details in the span panel; hovering a span in the waterfall (without clicking) shows a tooltip with the span name, its service, namespace, and version, its kind (coloured like the bar), duration, and status, without changing the selection. The span panel lists that span's events, giving exceptions an error treatment that surfaces the message, type, and stacktrace, followed by its attributes — the Span section open, then Scope and Resource collapsed behind a one-line summary (service, namespace, environment, version, pod, node, host, region, SDK, plus+N more) since a span's resource attributes repeat on every span of that service; a section with nothing in it is omitted and rows sort alphabetically. The sub-header compiles service name, namespace, deployment environment, and version from the resource attributes that carry them. Hovering a row offers group by (the group table regroups by that attribute) and, for attributes the facet sidebar knows, + filter, which returns to the list narrowed to that value. A value over ~200 characters (a RustDebugdump, a stack trace) collapses behind a "More" toggle rather than flooding the panel; the copy button always copies the untruncated value. Open-by-ID works from any level. A Waterfall | Map | Both switch sits above the trace: Map draws the services involved in that one trace — built from the spans already loaded, no extra query — as nodes sized by time spent in each service, with edges showing the calls between them; a failed call colours both its edge and the callee node red. Clicking a service node filters the waterfall to that service's spans until you clear the filter chip or click the same node again, and hovering a node or edge shows its figures in a tooltip. - Metrics — a visual query builder (metric picker, tag filters,
aggregation, and the
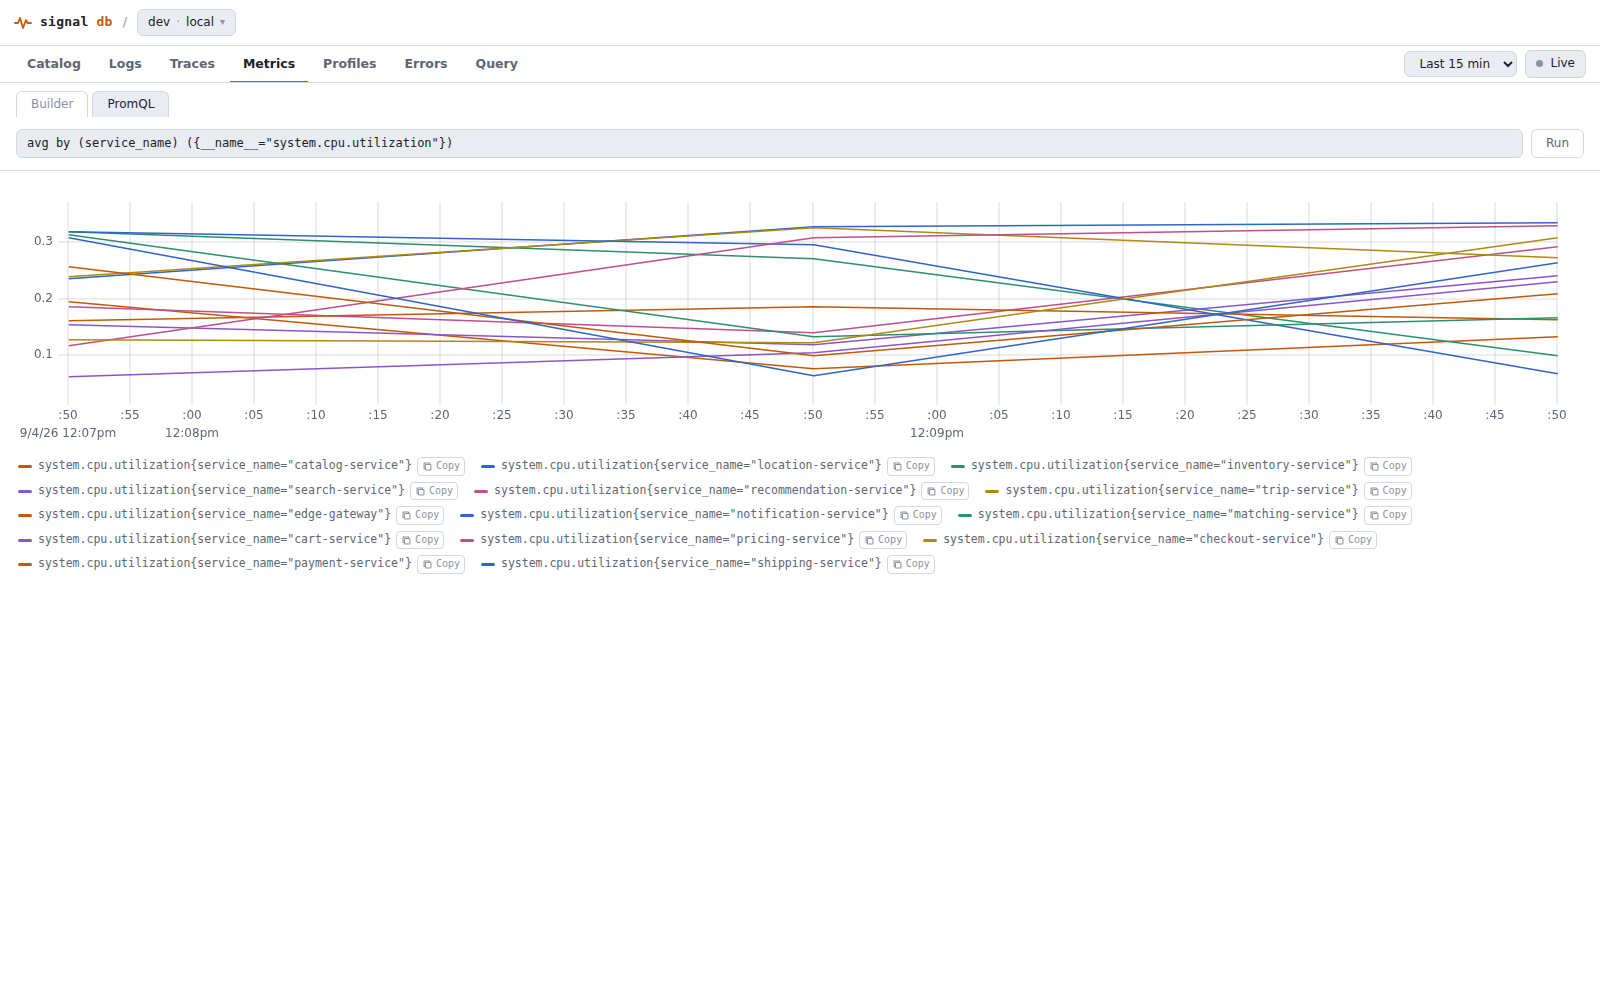
rate/increasecounter-rate functions, all populated from label metadata) with multi-query formulas for ratios — every builder row compiles to the Query IR, with no raw PromQL editor. See Building metric queries. - Profiles — a flame graph of stored profiles, filtered by service,
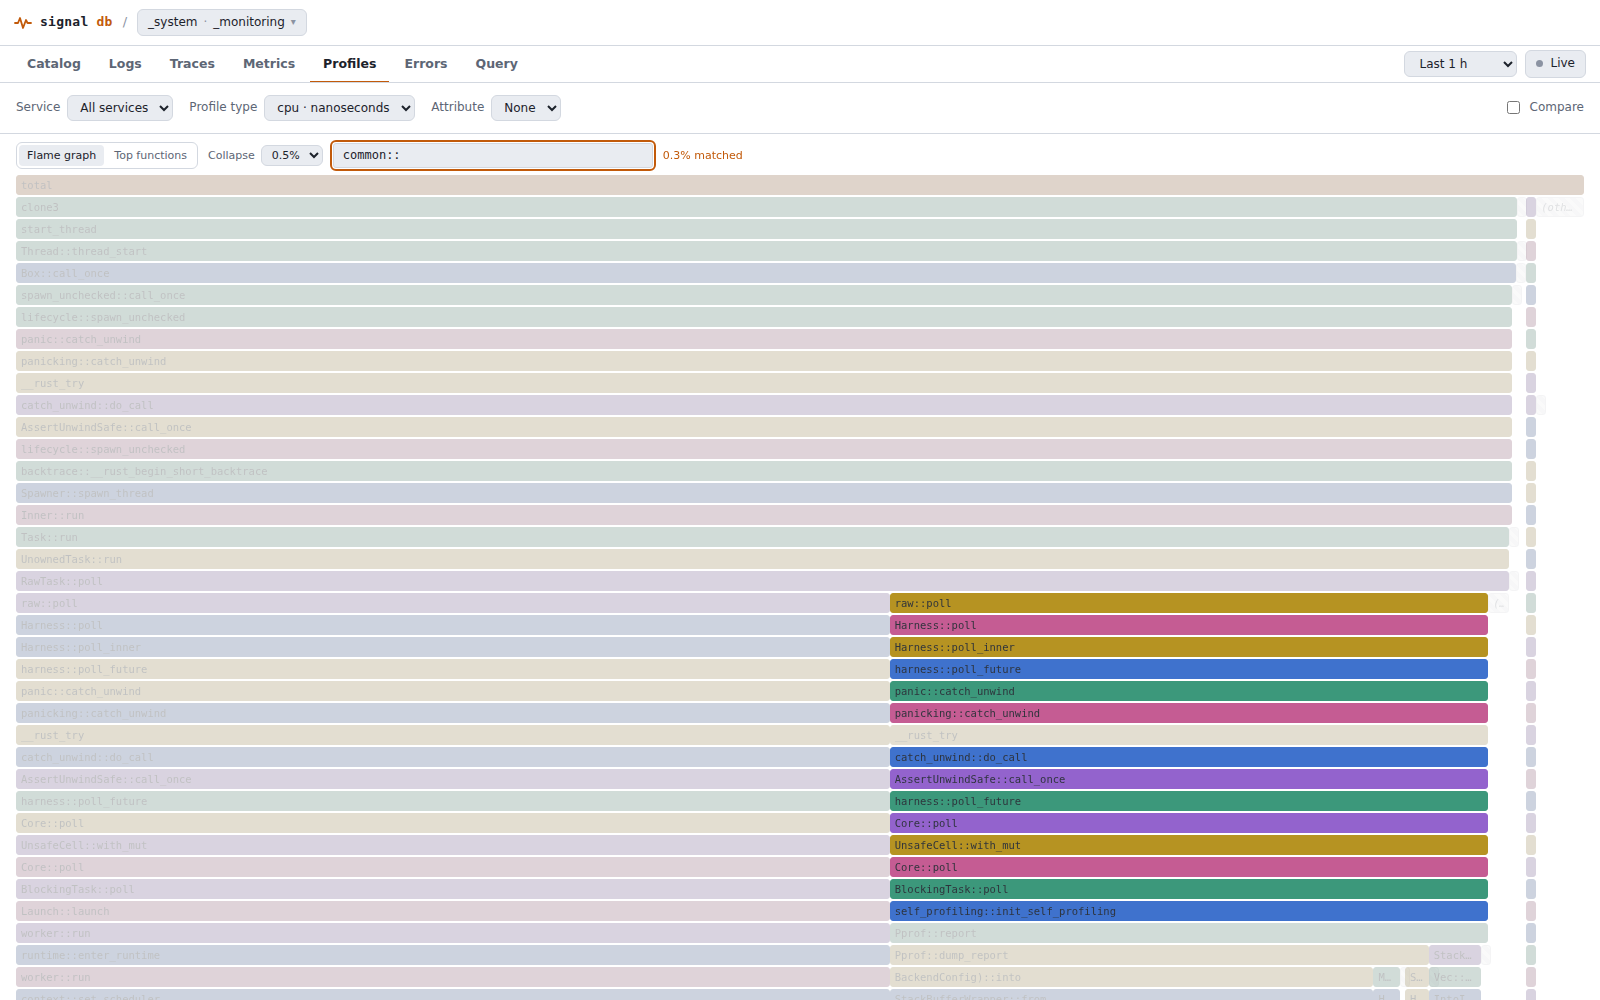
profile type, and (optionally) any discovered attribute. Click a frame to
zoom into its subtree; a breadcrumb (
root › ... › frame) tracks the path and lets you step back out one level at a time, not just all the way to root. Past four levels deep the middle of the path collapses to a single…crumb that stays readable in the toolbar instead of clipping; click it to reveal the whole path. Type in the highlight box to light up matching frames — e.g. a crate prefix likecommon::— while everything else dims, with a matched-share readout for finding your code in a library-heavy profile. A Compare toggle renders a baseline window (its own time-range picker) alongside the current range as two independent, independently-zoomable flame graphs, for spotting what changed. A Collapse selector folds below-threshold frames into a muted(other)bucket to cut visual noise, and a Top functions view swaps the tree for a sortable flat table ranked by self time. See Comparing and filtering profiles and Reading a noisy profile. - Errors — exceptions grouped by type, message, service, and whether
they were handled, sortable by count (default) or by last-seen recency.
Combines the two places OTel records an exception — a span's
exceptionevent, and a log record's ownexception.type/.messageattributes (see Exception attributes) — since neither source alone is the whole picture. A facet sidebar (type, service, source, handled) narrows the list. Selecting a group shows a count-over-time chart for that exact group (labelled with the window's start, middle and end times), its service (a link to that service's catalog entry), and its individual occurrences (up to 25, newest first); each occurrence independently offers a link into the trace waterfall when it carries a trace id — occurrences of the same group don't all share one trace outcome — and expands to its own stacktrace, rendered with the caller's own frames legible against dimmed dependency noise. The selected group (?group=) and the facet selection (?f=) live in the URL, so following a trace link and pressing Back lands on the same group; the occurrences panel scrolls into view on selection and carries an "← all groups" control. Grouping still needs anexception.typeattribute, so a note below the table counts any ERROR-or-worse log records in range that carry none and links to Logs (filtered to that severity) to see them, rather than silently omitting them with no trace of the gap. At phone widths the table drops the Service/Source/Handled/First seen columns, keeping Type, a two-line-wrapped Message, and Count. - Query — a native Query IR builder for
logs,traces, and profile summaries: pick a source and result envelope, add filter chips, and the tab emits a structured, versioned IR document (no dialect string) via the generated API client, rendering the declaredrows/series/tableresult. Any warnings the response carries are shown above the result — a group-by field nothing in the window carries names itself there, with the closest real field as a suggestion, instead of silently rendering onenull-labelled group. The builder is URL-backed (?qsrc=,?qres=, repeated?qf=, and?qrun=1once run), so a reload, a tab switch, or Back keeps the query; Run on an unchanged document re-runs it against a fresh "now". - Correlation — log rows with a
trace_idopen the trace waterfall; the span panel links back to logs filtered by that trace, and, for a span with a linked profile, offers a "Profile:<sample type>→" button that opens that exact profile's flame graph. Beyond those, any attribute the schema registry marks as identifying an entity (service.name,k8s.pod.name,host.name, …) is itself a pivot: its row in the span panel offers logs ↗ (the log list filtered to that value), its row in an expanded log line offers traces ↗ (the trace list narrowed by the matching facet), and both offer catalog ↗ when the row carries every attribute that identifies the entity, opening that entity's page. See What an attribute key means. Each of these pivots is a history entry: browser Back returns to the list you came from with its filters intact, and the waterfall's "← traces" control steps back the same way (to the log list when the trace was opened from a log row). - Live — the Live toggle tails Logs, Traces (groups, volume chart, a group's trace list, and the facet sidebar's value counts), Metrics, and single-window Profiles. It is disabled, with a tooltip saying why, on Catalog, Errors, and Query, and whenever the time range is absolute — a fixed window has nothing to tail.
- Refresh — the button beside the time picker re-runs the current view's queries on demand, and a relative range moves its "now" forward. The icon spins while any of them is loading (including Live polls, so it turns almost continuously with Live on); with reduced motion set it dims instead. Sign-in state and other lookups that don't depend on the time range are left alone.
- Every view is a URL: each signal has its own path (
/catalog,/logs,/traces,/metrics,/profiles,/query), with time range, filters, and selection in query parameters alongside it — so views are separately navigable and can be bookmarked, shared, and revisited with the browser back/forward buttons. A metrics builder run is carried as?mq=— the builder's rows and formula, JSON-encoded — so reloading or sharing the link restores the builder and re-runs the same IR query, dotted OTel metric names included. (A link from before the builder moved onto the IR carried a raw?promql=string instead; that param is no longer read.) When Back or Forward re-seeds the builder from the URL, the formula box is cleared with it, so a formula never refers to query letters that are no longer there. The tenant/dataset context rides along as?tenant=&dataset=; links that omit it (the Configure and Settings pages, deep links inside the schema hub) keep the last context you were in, and the last context is also remembered in the browser (cleared on sign-out) so a bookmark or a new tab opening a bare/schema/storage,/api-keys, or/manageresumes there instead of turning into a tenant-less request. Tenant/dataset administration lives at/manage. - Every view shares one visual vocabulary. A query that returns nothing
renders the same empty state everywhere, worded "No
in this range" (or "No yet" where nothing has ever been recorded), with any actionable hint on a second line, and announced as a status to assistive technology. Inline errors are one style, announced as alerts. Buttons come in one primary, one secondary, one ghost and one danger treatment, chips share one shape, table headers and body text share one size, page and dialog titles share one size, and toolbars and panes share one gutter, so the Logs search box lines up with the histogram axis and no page is padded differently from its neighbours.
The overview
/overview (the root / redirects here, as does the sidebar's wordmark)
answers three questions at a glance: is anything broken right now, what is in
the system, and how much is it ingesting. Every figure covers the selected
window, 30 buckets wide, and every row links into the view that explains it
— nothing filters in place.
- Environment. The
envpicker lists thedeployment.environment.namevalues seen on spans in the window and scopes every query to one of them (?env=in the URL); all leaves it unscoped. - KPI strip. Requests, error rate and p95 latency over root spans (end-to-end), each with the change against the equal-length window just before (rising errors and latency read red, rising traffic green) and a sparkline; the error rate turns red at 0.5%. Ingest is the number of records accepted across signals — spans, log records, metric points and profiles; the UI has no per-tenant byte counts to show. The Services card counts the services reporting and their health split.
- Deploys. There is no deploy event stream, so deploys are read off
spans: a service's
service.versionwhose first span in the window comes after another version of the same service was already reporting. The lane under the KPI strip places each one on the window's time axis; the same instants are dashed markers in the KPI sparklines (named in their tooltips) and in that service's row. - Service map. The tenant's service graph (the catalog Map's query) with zoom buttons, ⌘/Ctrl + scroll to zoom at the pointer, and drag to pan. Edges flow and critical services pulse unless the system asks for reduced motion. A node opens its catalog entry.
- Services. Worst health first, then busiest: critical at ≥ 2% errors, degraded at ≥ 0.5% errors or a p95 above 500 ms — the same error thresholds the map and every error-rate cell colour by. Rate, errors and p95 cover Server spans, as in the catalog; Last deploy shows an in-window deploy's version and age, otherwise the running version.
- Ingest volume. Records per signal per bucket, stacked, with totals and shares linking to each signal's view.
- Top error groups and Slowest endpoints (Server spans by p95, with p99) link into Errors and Traces with the group or endpoint selected.
- Setup checklist. The Setup button opens the steps that add
coverage to the page: traces, every service traced, logs and profiles
from every traced service, GitHub source links, and (for admins) a second
member. The admin step stays listed while the member count loads, so
the count doesn't jump; it drops out only if the count can't be read. Coverage is read off the window shown. The button hides once every
step is done; the palette's Open setup checklist opens it directly
(
/overview?setup).
Real users
/rum/{tab} shows browser telemetry per frontend app — a service.name
that sent at least one RUM event (a browser.web_vital,
browser.navigation, browser.user_action.click or
browser.resource_timing record, or any record carrying session.id) in
the window. The app switcher lists every such app, busiest first, and
defaults to the busiest; picking one writes ?app= and keeps the
current tab. With no frontend app yet, the page shows an
empty state pointing at Setup instead of empty panels. This build ships
the Overview, Pages, Sessions, Network, Interactions and
Setup tabs; Errors follows in a later change and is not shown as a
placeholder.
- Overview. Sessions, users, sessions-with-errors and traced requests
(distinct
session.id/user.id, the error share scoped to a session carrying anexceptionrecord, and the traced share, which is the share of the app's client HTTP spans with a server child span in the same trace), each with the change against the equal-length window before it and a sparkline computed from one bucketed read spanning both windows. Core Web Vitals shows LCP, INP, CLS, FCP and TTFB: the p75 ofbrowser.web_vital.valueperbrowser.web_vital.name(values are lowercase, in milliseconds except CLS), rated against the Web Vitals thresholds and shown by shape and colour; a vital with no records in the window reads—, never0. Each card's good/needs-improvement/poor distribution bar's tooltip lists every share and its threshold. Sessions over time stacks sessions with and without errors. Top errors reuses the Errors grouping, scoped to the app. Frontend → backend shows the app's top requests split into client+network and backend time (see Network below), linking to the full table. Sessions by browser and by device break down the window's records bybrowser.brands(when the SDK sends it — many deployments don't yet, so this can read empty) andbrowser.mobile. Slowest pages lists the top 5 routes by their worst Web Vital's poor share; a row opens the Pages tab with that route selected. - Pages. Every route (
url.template, or a template derived fromurl.fullwhen the record carries nourl.template) the app's users visited, with views (browser.navigationcount), p75 LCP/INP/CLS/TTFB and an error share (exceptionrecords carrying that route's ownurl.template, divided by views — an exception with no route attribution isn't counted), sorted by the worst vital's poor share. Picking a route writes?route=and opens its detail: the same Web Vitals cards as Overview, a load breakdown (p75 of DNS, connect+TLS, request→first byte, response, DOM processing, DOMContentLoaded and load, frombrowser.navigation_timing/browser.resource_timing), and backend calls —fetch/xhrrequests from that route, joined to the Network tab's own backend service names. Page views with no attributable route raise a callout explainingurl.templateand linking to Setup. - Sessions. Every
session.idseen in the window, one aggregate read: the session id,user.id, browser (parsed fromresource.user_agent.original) and device (browser.mobile), start time, duration (first to last record), page views, entry and exit route (url.templateof the first/last record — a null entry or exit means that record carried no route), and signal pills for error and slow-load (poor-rated LCP) counts. Two quick filters, "With errors" and "Slow load (LCP poor)", narrow the list client-side from those same counts; a free-text filter narrows the aggregate itself, matching asession.idoruser.idexactly, orkey=valueagainst any attribute. Picking a session writes?session=. - Network. The app's client HTTP spans, grouped by method and URL
template (derived client-side from
url.fullwhen the record carries nourl.template), each with calls, p75 duration, error share and traced share (a server-kind child span in the same trace, found via thecorrelatestage). The split bar shows the backend p75 (the server child's duration, over traced calls only) against the p75 of all calls; the client+network part is the difference of those two separate aggregates, so it's an estimate. An origin whose calls have a known tracing status and none joined to a backend trace raises a callout listing what to check (traceparentpropagation, CORS, backend instrumentation), linking to Setup; requests to the telemetry export endpoint itself are marked "SDK export" rather than counted there. A Resources table summarisesbrowser.resource_timingby initiator type: count, transfer size, p75 duration and the largest transfer. - Interactions.
browser.user_action.clickrecords grouped by target (browser.css_selector, showing its last few path segments — the full selector is in the row's title — orbrowser.tag_namewhen no selector was captured) and page, with a click count and a bar of that page's own INP p75 (joined from the Pages tab's data, not a second read). Rows link to the Sessions tab, scoped to the app (not yet to sessions containing that click). - Setup. Copyable snippets for instrumenting a browser app with the
upstream OpenTelemetry SDK: install, initialize with the app's
service.name, and export to an OpenTelemetry Collector or the app's own backend — never a SignalDB API key in browser code, since SignalDB keys are bearer credentials with no origin restriction and any key shipped to a browser is public. The collector/backend then forwards to SignalDB holding the key server-side. A live checklist tracks the first session, first page view, first vitals record and the share of client requests joined to a backend trace for the selected app. Step by step: Instrument a browser app. - Command palette. The Real users tabs and every frontend app with RUM
data are palette entries; picking an app opens
/rum/overview?app=.
Agent evaluations
The Evaluate group reads evaluator results for AI agents — offline eval runs first — and compares agent versions case by case. What to send and how each page reads it is in Evaluating AI agents.
- Eval sets (
/evals/sets) lists the dataset's eval sets with what their cases were built from and how the newest run of each scored. New eval set… starts a set from a JSONL file of cases, from real agent traces, or empty. A set's page (/evals/sets/{name}) shows its cases with each case's score in the newest run, Export JSONL, an Add traces panel that appends cases from matching agent traces, the Runs of the set, and a Settings tab to delete it. Details: Eval sets in the Explore UI. - Upload results… on Runs uploads a JSONL or CSV results file as one run, previewing its cases, evaluators and columns first; the dialog also holds the CLI command for CI and the OTLP log-record form. Details: From the Explore UI.
- Save N regressed cases as eval set on Compare turns the regressions into a new eval set, copying each case's input, expected tools and reference from the set the runs replayed.
The catalog
The catalog answers "what's actually sending telemetry" by discovery, not configuration. The entity types it can find come from your schema registries, not from a list baked into SignalDB: every entity an OTel registry declares — services, hosts, containers, processes, Kubernetes objects, CI/CD pipelines, service instances, telemetry SDKs — is catalogable, and a tenant that publishes its own registry gets its own entity types on the same terms, with no code change and no configuration.
The nav lists the entity types your telemetry actually carries, not all of
them. SignalDB works out which those are from the field metadata each signal
maintains — one lookup per signal, reading no signal data — and an entity
type appears once some signal carries the attribute that identifies it. So
the nav grows when a new SDK resource detector, an OTel Collector with
resourcedetection, or Kubernetes downward-API injection starts populating
an attribute, and it does not fill up with dozens of entity types you have
no data for.
What identifies an entity is resolved against your data too, not taken on
faith from the registry. An entity type is keyed by the identifying
attributes your telemetry actually carries — an attribute the registry
declares but nothing sends is dropped rather than lumping every instance
under one blank value. Where a registry declares no identifying attribute at
all (OTel 1.43 has 26 such entity types, host and container among them,
whose names are merely descriptive), the first descriptive attribute your
data carries stands in. That is what lets those entity types be catalogued
without SignalDB hard-coding a key for each one.
Which attributes make up that identity can differ by signal, and the catalog
groups each signal's instance list by what that signal actually carries, not
by the identity as a whole. A process identified by process.pid and
host.name is a case in point: a metrics pipeline that reports process.pid
but never attaches host.name still lists its processes, grouped by pid
alone, rather than collapsing every one of them into a single "no host"
bucket — the same defect a naive fixed-tuple grouping would produce. A signal
missing the primary identifying attribute altogether contributes no
instances rather than a coarser listing.
That metadata is maintained by compaction, so a freshly-ingesting deployment may not have been analyzed yet. The catalog says so — "not analyzed yet" alongside the age of the metadata it used — rather than showing an empty nav, which would read as "you have no entities" when the truth is "we have not looked yet". A request that genuinely fails (a missing dataset, an authorization error) shows that failure instead of the benign "not analyzed yet" note, so a real backend problem is never mistaken for an uncompacted deployment.
An entity type whose attribute is present but has no values in the selected
window renders an explicit empty state naming the attribute and the signals
it looked in, rather than a placeholder row. Where SignalDB knows the
attribute has values outside your window, it says so — "3 values have been
seen outside it (as of …), such as ix-signaldb-mcp-1. Try a wider time
range" — which separates "nothing here right now" from "nothing has ever
reported this", two findings that call for opposite next steps. That comes
from the same maintained statistics as everything else on this page, so it
describes what compaction last saw rather than your selected range; it can
tell you values exist, never that they are current. When no statistics cover
the attribute, the empty state stays quiet instead of claiming nothing has
ever been seen.
The service entity type's list offers a List | Map switch, kept in the
URL (?cview=map) so a link reopens the map. The Map draws the tenant's
whole service graph for the current window and filters — one server-side
graph query (see the graph envelope)
the UI, MCP, and CLI all share — with each service node showing request rate, error
rate, and p95, edge thickness scaled by call rate, and edges colored by
error rate (neutral below 0.5%, warning from 0.5%, critical from 2%).
External dependencies (a database, a message broker, any callee that never
reported spans of its own) are drawn distinct from instrumented services and
can be hidden with the Hide external toggle. Clicking a node opens a side
panel with its rate, error rate, p95, callers, and dependencies, plus links
to that service's own page, its traces, and its errors. If the graph exceeds
[querier].graph_max_nodes or a window's span-join hits its row cap, a
notice above the map says so rather than silently dropping nodes or edges.
Catalog selection is part of the URL path: /catalog/<entity> lists an
entity type (service, database, messaging_destination, host,
k8s_pod, …), /catalog/<entity>/<identity> opens one entity's detail
page, and /catalog/<entity>/<identity>/<row> a breakdown row drilled into
within it. <identity> is the entity's identity values, percent-encoded and
comma-joined (/catalog/service/checkout,shop for service.name=checkout,
service.namespace=shop), so entity pages are bookmarkable and shareable
like every other view; tenant, dataset, and time range stay in the query
string. <entity> names any entity type the tenant carries, registry-derived
ones included (/catalog/process_executable/...) — a link naming one this
tenant has no entity type for says so rather than opening some other type's
page under that name.
An entity keyed by a resource attribute (service, host, Kubernetes
pod/node, container, process — anything an SDK's Resource carries, not
just spans) is discovered from every signal, and its Last-seen column is
the merge of them: a process that only ever emits metrics, never traced and
never logged, still shows up. This matters more than it sounds — process.pid
and container.name typically ride on metrics and on nothing else, so
processes and containers are invisible to a trace-only catalog even though
their data is already stored. Each entity type is queried only against the
signals that carry its identity, so nothing pays for a signal that cannot
match.
An entity keyed by a span attribute (database, message destination — these describe one client call, not the process that made it) is discovered from traces only.
The list answers "which entities are there", so it carries no sample counts — how many spans or log lines back an entity is a fact about SignalDB's storage, not about the thing being observed, and volume from different signals is not comparable anyway (400 spans plus 2,000 log lines is not "2,400 requests"). Request rate, error rate and P50/P95 latency are all derived from traces — a log line has no span status or duration to measure — so an entity no trace ever carried shows "–" in all four rather than a misleading "0%" and "0ms" that would report an uninstrumented service as a flawless one. Which signals cover an entity is shown on its detail page, under Signals; that is what tells you whether a missing latency number means "healthy" or "not instrumented for tracing".
The subtitle under each entity type's heading ("discovered from ... across traces, logs") names exactly which attributes and signals fed it.
Where the registry associates a metric with the entity type, the list also carries a sparkline column for it, so a type no trace ever touched is not a table of dashes. The metric charted is the first the entity type is associated with that the window holds, and the column header names it — a row with no data for it stays empty rather than drawing a flat line.
Selecting a row opens that entity's own page, top to bottom:
- A breadcrumb, the entity's title, and (for a drillable entity type) Logs
and Traces buttons that jump to those tabs pre-filtered to this exact
entity — Logs only appears when every identity dimension is one a log
record can also carry (a span-only attribute like
db.namespacehas no Logs equivalent, so the button is left off rather than jumping to a view that silently ignores part of the entity). - Three KPI cards — Rate, Errors, Duration (p95) — each with its own sparkline and, where the window allows a same-length comparison, a "vs prev" change figure toned by whether that direction is good, bad, or (for Rate) neither. All four are derived from traces; an entity no trace ever carried shows "–" rather than a misleading "0%"/"0ms" reporting an uninstrumented service as flawless. Which signals cover the entity is named next to its title, under Signals.
- Operations, for entity types that define a breakdown (services by
span.name, databases bydb.operation.name, infrastructure types by which services were observed alongside them): a searchable, sortable table with a per-row "last hour" sparkline, capped to the top 8 by rate with a "show all" toggle once search or the toggle asks for more. A row drills one level deeper the same way the top-level catalog does. - Error groups, on a service's own page: its top 5 exception groups by
count (type, message, source, last-hour sparkline, count, last seen),
drilling into the same group detail the Errors tab itself opens, plus an
"All errors for
<service>" link to the full Errors tab filtered to it. - Time by dependency, also service-only: a proportional bar and legend —
a small colored swatch per kind, not a full-block background — breaking
down where the service's outbound time goes (database, HTTP, RPC,
messaging, discovered from
db.system.name,http.request.method,rpc.system,messaging.system), and beneath it a per-dependency table (target, kind, share of request time, P95, calls/request) with a(self)row for the time no downstream call accounts for. - A service map, next to Time by dependency and also service-only: a
one-hop neighbourhood — the service centred, its callers on the left, its
dependencies on the right — from the same
graphquery as the Catalog Map (thegraphenvelope), scoped to this service (focus/depth=1). A Map | Table switch shows the same edges as a table. Clicking a neighbouring service opens its own page with the same time range; a service with no incoming calls in the window says so rather than showing an empty column. - Slowest traces: the entity's 8 slowest spans in the current window. For a service these are its inbound (server) spans, the requests it handled, so a service in the middle of a call chain lists its own slow requests too. Other entity types list their slowest spans that carry the entity's identity. The section has an "Open in Traces" link that jumps to the Traces tab pre-filtered the same way the header's Traces button does. Opening a row goes straight to its trace waterfall.
- The entity's metrics panel, last on the page — supplementary context rather than the primary signal a service/host/process page leads with.
An identity value the catalog shows as (not set) becomes a filter for spans
that carry no such attribute at all (a (not set) chip on the Traces tab,
field|absent in the URL) rather than being dropped, so a Logs/Traces jump or
the Slowest-traces link lists the same traces the entity page counted instead
of every trace in the window.
The metrics panel's contents are the registry's answer rather than a list
maintained in the UI: a metric definition declares the entity it measures, so
a host is charted with the system.* metrics, a container with
container.*, a process with process.* — and a tenant publishing its own
registry gets its own metrics charted on the same terms, with no code change.
That is what stops an entity whose telemetry is metrics rather than traces
from being a page of dashes.
Only metrics the selected window actually holds are charted; an associated
metric a deployment never emits is absent rather than drawn as a flat zero,
and an entity type the registry associates no metric with shows no metrics
section at all. Every tile names its instrument and unit, which matters for
counters: a cumulative counter is charted as the cumulative value it is, not
as a rate. A long metric name ellipsizes rather than pushing the instrument
and unit off the tile, and both carry a title with the full text. A metric
whose unit is bytes gets a y-axis in KB/MB/GB, the same scale its
tooltip uses, rather than a raw count with a K/M suffix; a gauge that
goes negative is compacted by magnitude and keeps its sign, and the axis
gutter leaves room for it. Where an entity associates more metrics than fit,
the panel says how many it is not showing rather than truncating silently.
"Services" is scoped to server-kind spans specifically: a service's own resource attributes appear on every span it emits, including calls it makes to its dependencies, so without that scope its request rate/latency would mix inbound and outbound traffic.
Comparing and filtering profiles
Every flame graph the Profiles tab renders — the single view, each side of
a comparison, and a profile opened from a trace span — is fetched through
the native Query IR profiles source, not a separate
profiling-specific query language. The Service and Profile type selectors
compile to service.name/sample.type filters; the optional Attribute
selector compiles to a filter on whatever profile-level attribute key you
pick (populated from the profiles seen in the current time range) — the
same attribute-container resolution the Query tab uses, so anything visible
there as a filterable field is filterable here too.
Compare replaces the single flame graph with two independent ones, a Baseline window (its own time-range picker; when Compare is switched on it defaults to the window immediately preceding the comparison range, so the two panes never show the same data) and the current range as the Comparison — each fetched, zoomed, and searched independently, so you can drill into the same subtree on both sides to see where time moved. There's no synchronized zoom between the two panes; it's two ordinary flame graphs side by side, not a merged diff-coded one.
Opening a profile from a trace span's "Profile: <sample type> →" button
renders that one profile's actual payload — matched by its exact stored ID,
not re-aggregated from a service/type/time filter — with a "← profiles"
button back to the normal filtered view. The link carries the profile's
sample unit (punit in the URL), so the flame graph is labelled in that
unit straight away instead of first looking it up in the profile-type list.
Reading a noisy profile
A wide, deep profile — especially a Rust one, where monomorphized generics and full module paths make individual frame names long — gets hard to read fast. Two controls, alongside the highlight box, cut through it:
- Collapse folds every frame narrower than the chosen threshold (Off,
0.5%, 1%, 2%, 5% of the root — 0.5% by default) into a single muted,
dashed
(other)bar per contiguous run, along with that frame's entire subtree (a child can never be wider than its parent, so anything under a collapsed frame is noise too). It's computed against the profile's total, not the current zoom, so a frame that's negligible at the root doesn't reappear artificially large just because you zoomed into its parent. Changing the threshold resets any active zoom, since the frame you'd zoomed into may no longer exist as its own bar. - Top functions replaces the tree with a flat, sortable table — Function,
Self, Self %, Total, Total % — aggregating every occurrence of each
function name (so a recursive function's self time is summed correctly;
its total isn't, the same caveat
pprof tophas). It's the "what's actually expensive" view when the tree shape itself isn't what you need. Clicking a row switches back to the flame graph with that function highlighted, so you can see where the time is spent structurally.
Bar labels are shortened, too — a Rust name for a monomorphized generic
method (<Type as Trait>::method::<Args>) can run to hundreds of
characters, and worse, the default right-edge ellipsis cuts off exactly the
distinguishing part (the generics at the end), leaving unrelated frames
looking identical once truncated. Bars show roughly Type::method instead.
This is display-only: hover any frame (or a row in the top-functions table)
for a tooltip with the full, unshortened name plus self/total, and the
detail line and highlight search still operate on the real name.
Reading a log line
Selecting a log line expands it into the three attribute scopes the Query IR keeps apart (see Addressing an attribute scope), in this order:
- This line — the trace context (
trace_id,span_id; thetrace_idrow and the "View trace" button both open the trace) and the log record's own attributes (code.*,http.*,event.name, an application's own keys). Always shown, even when empty. - Scope — the instrumentation scope's attributes, when the record carried any; omitted otherwise.
- Resource —
service.nameplus every resource attribute (service.*,host.*,k8s.*,cloud.*,container.*,telemetry.sdk.*, …), the same values on every line the resource emitted — collapsed behind a one-line summary (service, namespace, environment, pod, host, region, image, then+N more); expand it for the full table.
The same key can appear in more than one group with a different value —
each group shows its own copy rather than merging them, so a
service.name log attribute and the resource's service.name are both
visible.
Every row offers + filter and − exclude, compiled to an IR where
predicate on the attribute's own key.
What an attribute key means
Wherever the UI shows an attribute key as a label — the expanded log line, the span-detail attribute table, the logs field sidebar, the trace facet headers, and the filter chip's key suggestions — it resolves the key through the schema registry for the active tenant. A known key keeps its raw spelling (still copyable) and gains a dotted underline; the row itself shows only the key and its value. Hovering or focusing the key, or the info glyph that appears beside a sidebar entry or facet header, opens the full definition — description, type, stability, examples, the defining registry, the entity the key identifies or describes, and every other registry that also defines the key, so a tenant's own definition never hides the upstream one. A descriptions checkbox on the detail panels (remembered in the browser) switches to a reading mode that adds each known key's one-line description under its row.
Rows in the detail panels are grouped under the owning registry group's title
(for example "Kubernetes", from the registry group "Kubernetes Attributes"); the heading states once what every row
in the group shares — the defining namespace (otel, or a custom registry's
name, highlighted) and the entity the group describes (◆ when it identifies
it, ○ when it merely describes it). A group with a single row is folded into
the trailing "Other" group alongside keys no registry knows, so a short list
does not become a stack of one-row headings, and a list where nothing forms a
group renders flat. A key the convention deprecated is struck through with its
replacement inline (http.method → http.request.method).
The logs field sidebar uses the same titles: a pinned Line group (level, service, event name) first, then one collapsible group per registry family (Kubernetes, Cloud, Host, …) with its count, then Deprecated keys with their replacements, then Other; the filter box matches group titles as well as keys and shows every match expanded.
Resolution runs in the background and is cached for the session: rows render at once with the raw key and pick up the semantics when they arrive, and an unavailable registry endpoint just leaves the keys bare, with no error in the panel. Typing in the filter chip's key input merges the registry's prefix search (each suggestion with its one-line description, and a namespace tag only for a custom registry's key) with the labels observed in the current data, so an observed key the registry does not know remains suggestible — marked "seen", without a description. Deprecated keys sort after current ones and show their replacement, though picking one still filters on the deprecated spelling.
Narrowing traces
The traces tab has a facet sidebar. Expanding a facet lists its values with the number of matching spans across the whole selected window — not just the traces the list happened to fetch — most frequent first. Selecting a value adds a filter; filters appear as removable chips and narrow the trace list, the group table, and the volume chart together, so the chart always describes what the table shows. Filters live in the URL, so a narrowed view is shareable.
Facets currently cover service.name, span.name, status, and span.kind,
plus a curated set of common resource/span identity attributes (host.name,
the k8s.* fields, db.namespace, …) — a defined logical field per facet,
not an enumeration limit; a facet for another
attribute is a UI addition, not a backend one. To slice by any other
attribute today, use the "Group by attribute" custom dimension field below
the group table: it now suggests the attribute keys actually observed in
the current window (merged with schema-registry hits), backed by the Query
IR's describe: fields on traces — the same discovery stage that
replaced /api/search/tags
(#1073).
Both the facet sidebar and the traces' span-detail panel are resizable: drag the handle on the sidebar's trailing edge. The facet/field sidebar's width is shared between the logs and traces tabs and persists across sessions.
Below a 900px-wide viewport the facet/field sidebar (Logs, Traces, and Errors alike) is hidden by default rather than shown at a squeezed width; a Filters button (Fields in the Logs query bar) reveals it as a dismissible drawer (close button, backdrop click, or Escape). The traces' span-detail panel does the same below that width: selecting a span shows a Details button in the trace header that opens the panel as a drawer from the right. Below 720px the navigation sidebar becomes a top bar with a drawer (see Navigation). Below 600px, each log row puts its message on its own line under the timestamp, level, and service, clamped to three lines. At the same width the trace group table drops its Rate, P50, and Last seen columns rather than pushing them into a horizontal scroll; Errors and P95 stay.
The group table
Traces are presented grouped, one row per distinct value of the grouping dimensions, carrying RED for that group: request count, rate over the window, error count, and p50/p95 duration, plus when the group was last seen.
Every one of those numbers is a server-side aggregate over the whole selected window. The row budget (500 groups) bounds how many groups come back, never the records they are computed from — so a group's p95 is the p95 of all its records in the window, and changing the row limit does not move it. When more than 500 groups exist the table says so; it does not claim a total, because the number of distinct groups is not something the query returns.
Grain selects what a row counts:
| Grain | A row counts | Duration is | Filters match |
|---|---|---|---|
traces |
traces (root spans) | the trace end-to-end | the root span only |
spans |
matching spans | each span | any span |
Trace grain is the default. Because it scopes the query to root spans, a filter
on a field that only ever appears on a child span — a db.system on an inner
call, say — legitimately matches nothing and the table is empty; switch to span
grain to see those matches. Matching a trace because any of its spans matches,
while still grouping by the root, is a structural query and is not available
yet. The grain lives in the URL, so a shared link reproduces it.
Grouping is by span name and optionally a second dimension. Beyond the
built-ins (span.name, service.name) you can type any attribute name —
http.route, deployment.environment — and the server groups by it directly,
including a bucket for records carrying no value for it.
Sorting re-runs the query rather than reordering the rows on screen. This matters: the table holds the top 500 groups under the current sort, so reordering those locally would answer "the slowest of the 500 most frequent groups" instead of "the 500 slowest". Sorting by rate is the same ordering as sorting by count, since rate is count divided by a fixed window.
Reading the volume charts
The logs and traces tabs both open with a stacked volume chart — logs by severity level, traces by span status (span rows, not distinct traces).
Both charts are server-side aggregates over the whole selected window. They are not derived from the rows in the list below them, so the row limit never truncates them: a chart that looks flat is reporting flat data, not a truncated query.
Point at any bucket — anywhere in its column, however short the bar — for its timestamp, a per-series breakdown, and the bucket total. Buckets are also focusable, so the same detail is reachable with the keyboard.
The traces tab's span-volume chart also offers a latency heatmap alongside the histogram and area views, backed by its own query; whichever view is selected shows a loading indicator while its query is in flight and an error message if it fails, rather than an empty chart with no explanation.
Chart tooltips
Every chart in the UI reads back the exact data under the pointer through the same tooltip: the metrics chart lists every series at the pointed timestamp with its colour swatch and value (a dash where a series has a gap); the trace volume area chart and the logs histogram show the bucket's time range, per-series values, and total; the latency heatmap shows a cell's time bucket, latency range, span count, and share of its column; the error sparkline shows a bucket's occurrences; the catalog's dependency bar shows a category's time, share, and call count; and the flame graph names a frame with its self/total time. The tooltip follows the pointer and stays inside the panel: it flips to the left past the panel's midline, and near the bottom edge it flips above the pointer only when the panel has room there, otherwise it pins to the top edge rather than painting over whatever sits above the chart. It never gets in the way of the data.
Each chart is a single tab stop. Tab lands on the chart's active bar, cell,
segment, or frame (the last one you pointed at, or the first), and the arrow
keys move between marks — left/right along a row or level, up/down across
heatmap rows and flame-graph levels — with Home/End jumping to the first
and last. The focused mark shows the same tooltip and announces the same
content to assistive technology as hovering it; the metrics chart, drawn on a
canvas, is pointer-only. Pointing at an empty region shows nothing.
Two controls sit beside the time axis. Bucket width sets the chart's resolution — it defaults to a width chosen for the selected window, and each offer states how many buckets it produces, so "finer" and "coarser" are concrete. A width chosen for a narrow window is not carried over to a much wider one, which would otherwise issue a needlessly expensive query.
One busy bucket can dwarf the rest of the window: at a 36:1 ratio the typical bucket occupies about 5% of the chart's height. The log scale toggle beside the time axis compresses the vertical range so the baseline stays readable next to a spike. It applies to the bucket total, with each stacked series keeping its true proportion of the bar. Both controls travel in the URL — a shared link opens on the same resolution and scale the sender was using.
A series that is present in a bucket is always drawn, however small its share: a handful of errors among tens of thousands of other spans stays visible as a thin band rather than rounding away.
Building metric queries
The metrics view is a visual builder over the Query IR
metrics source — there is no raw-query editor here (for hand-written
queries against any source, including metrics, use the Query IR
tab, or query PromQL-compatible tools like Grafana directly
against /prometheus/api/v1). A query row reads left
to right as a sentence:
[ a ] metric ▾ from ⟨ filters ⟩ avg by ⟨ group ⟩ function ▾ window across ▾
- Metric — type or pick a metric name. Focusing the box opens a
suggestion list (typing narrows it, arrow keys move the highlight, Enter
or a click picks it); the names come from the Query IR's discovery stage
(
describe: valuesonmetric.name) for the current time range, run against bothmetrics(gauges and sums) andmetrics_histogram— the two scalar and bucketed shapes are separate IR sources. A name that exists only inmetrics_histogramstill shows up (so searching for it isn't a dead end) but renders greyed out and labelled "histogram · not chartable yet": this builder always queriesmetrics, so picking one would run and return nothing. When a time range has no metrics at all, the list shows a single muted "No metrics in this range" row instead. - from — add tag filters (
+ filter). Label names and their values are suggested from the same Query IR discovery stage (describe: fields/values), so you filter on what exists rather than guessing. Each filter has an operator (=,!=,=~,!~). - aggregation — choose a space aggregation (
sum/avg/min/max/count) and an optional comma-separated group by to get one series per tag value. - function — an optional per-series range function:
rate/increase(see Counter rate),irate, oravg_over_time/min_over_time/max_over_time/sum_over_time/count_over_time(see More range functions). - window — an optional lookback window (
5m,30s, …) for the selected function, independent of the chart's own step width. Left blank, it defaults to the step, which is today's behaviour. - across — how the function's per-series values fold into each group
(
sum/avg/min/max/count, defaultsum) — this is whatavg by (service) (rate(...))needs.
Labels are annotated with their approximate value count (the cardinality
estimate describe: fields reports for each one), and grouping by a
high-cardinality label — one that would explode into thousands of series, like
a pod or trace id — shows a ⚠ warning before you run it.
The metric box sizes itself to the metric name, and the group-by box grows
with what you type, up to the row's width. The row wraps onto a second line
once its parts no longer fit, so a long dotted metric name is never clipped.
Each box also carries its full value as a title. On a phone, the metric
stays on one line with its query letter and the from keyword.
Run compiles the row to an IR document and charts it — a dotted
OTel-native metric name (e.g. signaldb.wal.entries_processed) works
directly, where PromQL's grammar can't even lex it. Series take one of
twelve colours in order; past twelve, the colours repeat with a different
dash pattern, so two series sharing a hue are still distinguishable in the
chart and the legend.
The legend and the chart tooltip name each series by its label values, for
example checkout rather than {service_name="checkout"}, with several
values joined by ·. Hover a legend entry to see its full selector. The
Copy button at the end of the legend copies every series' selector, one
per line. The time axis shows the date only on the first tick and wherever
the day changes.
Formulas across multiple queries
Add more rows with + query — each gets a letter (a, b, …) — and combine
them in the formula box, e.g. an error rate:
formula: (a / b) * 100
A formula compiles the whole builder to a single multi-query IR request (see Formulas): every row becomes its own named query and the querier evaluates the expression over their joined results server-side, in one round trip. With no formula, the first row is charted on its own.
Signing in
Sign-in lives at /login, a standalone page (brand, one card, no navigation
sidebar) served with the rest of the UI. It is the destination for
sign-out, for bookmarks, and for every redirect-based login, and it accepts
two query parameters:
?redirect=<path>— where to go afterwards. Only a same-app path is honored; anything else falls back to/logs. An already-authenticated visitor is forwarded straight to the target without seeing the form.?error=<code>— a failed redirect-based login lands here with a code that renders one generic alert:sso_failedfor any SSO validation failure,no_membershipwhen a non-admin SSO login resolves to no tenant membership. The page then dropserrorfrom the URL so a reload does not repeat it.
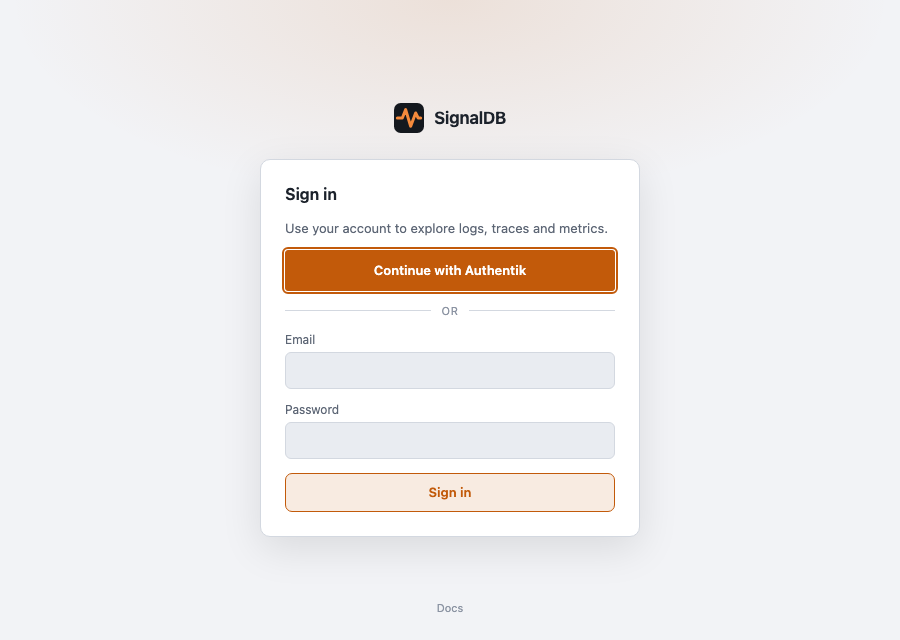
Which credentials the card offers comes from GET /ui/session/config, read
through the generated client — never guessed. With
{"password_enabled": true, "oidc": null} (every instance today) it shows
the email/password form. Once an instance reports an OIDC provider, a
"Continue with …" link appears above the form (or alone, when password
login is disabled); that link is a plain full-page navigation to the SSO
start endpoint carrying the validated redirect target. If the probe itself
cannot be read, the page falls back to the password form with a notice and
never offers SSO, so break-glass password access stays visible during a
partial outage. See Signing in with SSO
for the identity-provider side of this flow.
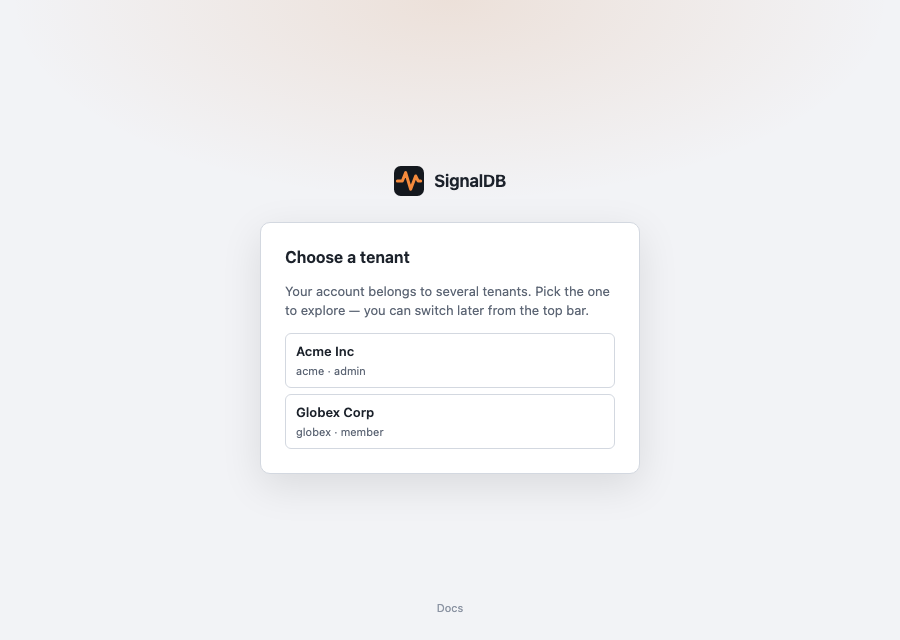
Every credential then hands over to the same tenant step: a sole membership
is auto-selected (with the tenant's default dataset); several memberships
show a selector listing each by name and role; none shows a "no tenant
access yet" message with a sign-out action. After a password login the
memberships come from the POST /ui/session response; after a
redirect-based login the page asks GET /ui/session, which introspects the
cookie without a tenant header (see
the authentication reference).
A query that fails as unauthenticated mid-session redirects to /login
with the current page as the ?redirect= target, rather than popping a
dialog over it; signing in there (by password, or by SSO) lands back on
that page. The OAuth consent screen redirects the same way on its own
unauthenticated check.
Any URL — including the site root (/) with ?tenant=&dataset=
attached — that doesn't match a known route redirects home to
/overview, preserving its query string, so a tenant/dataset carried on a deep link or
external redirect survives the trip instead of landing on an empty,
tenant-less page.
Signing in calls POST /ui/session, which validates the credentials and
sets an HttpOnly, Secure, SameSite=Lax cookie containing an opaque
random token. The password and tenant API keys never live in the cookie,
page JavaScript, localStorage, or URLs. A session starts with a 12-hour
lifetime and slides forward automatically while it's active — any
authenticated request made within 6 hours of expiry extends it another 12,
so a user who keeps working never hits the cliff. It only lapses after 12
hours of inactivity, or after 30 days since login regardless of activity,
whichever comes first. DELETE /ui/session revokes the server-side session
and clears the cookie.
Once signed in, the tenant/dataset selector offers the user's tenant
memberships and the selected tenant's datasets. The chosen values are sent
as X-Tenant-ID/X-Dataset-ID; the server validates the tenant against the
current user's memberships. Switching tenant or dataset only changes the
context — you stay on the page you are on (a signal view, the Schema hub,
/api-keys, …); it never routes you elsewhere.
In development the Vite proxy injects credentials from .env.local
instead, so no sign-in is needed.
On a demo instance the login page also shows an Explore the demo button that signs in with the shared read-only account; the header then carries a "Demo · read-only" badge and settings and admin actions are hidden.
Navigation
Every page sits in one shell: a navigation sidebar on the left, and a page header across the top of the main column.
- Sidebar. The signaldb wordmark, the tenant/dataset switcher, then the pages in groups — Monitor (Overview, Errors, Catalog), Investigate (Logs, Traces, Metrics, Profiles, Query), Evaluate (Agents & scores, Compare, Eval sets, Runs, Evaluators — see Evaluating AI agents), Configure (Schema, Processors, Send data) and, for tenant and instance admins only, Settings (Manage, API keys, Integrations). The read-only demo account doesn't see Schema or Processors. At the bottom are your account (which opens the user menu) and Collapse. Links to explore pages carry the current time range and tenant/dataset; filters and search stay with the page you left.
- Collapsing. Collapse (or the
[key, outside text fields) shrinks the sidebar to icons. It starts collapsed below 1024px and expanded above; once you toggle it, your choice is remembered in this browser at every width. - Tenant/dataset switcher. Lists your tenant memberships and the current
tenant's datasets. Picking a tenant resets the dataset to that tenant's
default and keeps the list open; picking a dataset applies it and closes
it. The choice goes into the URL (
?tenant=&dataset=) and becomes the sticky context described above. - Page header. A "Group / Page" breadcrumb, and a search field that
opens the command palette. On a detail page the breadcrumb gains the item
you're looking at, and the page crumb links back to its list: a trace
shows its short id ("Investigate / Traces / 4bf92f35"), a catalog entity
its name, an eval case its id, a schema registry
namespace@version(Edit … or New registry in the editor), and a processor its name (New processor while creating one). - Phones. Below 720px the sidebar gives way to a 48px top bar (menu, wordmark, current page — or the detail item on a detail page — search, account); the menu button opens the pages in a drawer, which closes on navigation, backdrop tap or Escape.
Command palette
⌘K (Ctrl+K), the header's search field, or the phone top bar's search button opens a palette centered over the page. With nothing typed it lists every page you can open, grouped as in the sidebar (Settings only for admins), then your recent queries and a few actions. Typing filters pages, the catalog's services (jumping to their catalog entry), recent queries and actions (Invite members, Create API key, Instrument a service, Connect GitHub, Switch tenant, Open setup checklist). Pasting a 32- or 16-digit hex trace id offers a direct jump to that trace. ↑/↓ move the selection, Enter opens it, Escape closes the palette.
Recent queries are the last ten logs searches and trace filter sets you
ran, kept in this browser's localStorage (sdb.recentQueries); they
aren't stored on the server or shared between browsers, and Sign out
clears them.
User menu
Once signed in, your account at the bottom of the sidebar (the avatar in the phone top bar) opens a user menu. It holds account items only; pages live in the sidebar.
- Appearance — toggle between light and dark theme; the choice is
persisted in
localStorageand restored on reload. - Docs — opens the SignalDB documentation in a new tab.
- Switch tenant — opens the Tenant Selection page (see below).
- Sign out — deletes the session, clears the query cache, and
reloads on the
/loginpage. If the sign-out request fails the menu stays open with an inline error instead of reloading a still-signed-in session.
The menu closes on Escape or backdrop click.
The signaldb wordmark at the top of the sidebar is a link to the Overview, carrying the current tenant/dataset and time range.
Management panel (/manage)
Tenant-admin-only. A deep-linkable panel (not ad hoc component state, so it
survives a bookmark or browser back/forward) covering the tenant's
self-service surface in one place: Datasets (create, delete non-default
ones), API keys (the count of active keys and a link to the
API keys page, the one place keys are created, scoped
and revoked), Members (add or update a role by email, remove), Tables
(the tenant's provisioned signal tables, grouped by dataset with one heading
per dataset, refetched immediately after provisioning; a Provision tables
action calls the manual-trigger endpoint — see
table provisioning), and, for
instance administrators only, New tenant. Destructive actions (delete a
dataset, remove a member) swap the button for an inline
confirmation first; Escape or Cancel backs out. Close, Escape, and a
backdrop click step back to the page the panel was opened from, or to the
Overview when the panel was the first page of the tab (a bookmark or a
new-tab link). A whoami failure that isn't a 401 shows an inline error with
the message instead of silently bouncing home; only a resolved
non-admin role redirects (to the Overview, as do the API keys and GitHub
pages). All of it consumes the
generated client (src/ui/src/api/management.ts), never raw fetch.
The tenant's default dataset carries a Default badge instead of a delete
button — it can't be deleted — rather than silently omitting the button with
no explanation.
Tenant selection (/select-tenant)
Shows every tenant the user is a member of, with their role on each.
The current tenant is expanded by default to reveal its datasets;
clicking a dataset navigates to the ?redirect= target (default /logs)
with ?tenant=&dataset= set on that URL in a single navigation, so the
pick lands in the address bar and the top-bar chip together. Other tenants
are collapsed and fetch their datasets lazily via whoami(tenant_id) on
expansion. Until a tenant is resolved the shell sends no tenant-scoped
whoami at all — a signed-in visitor landing on a bare URL is routed here
by the session, never to the login page.
View source (GitHub)
Wherever a stack frame's file and line are known — an exception event's
stacktrace in the trace detail panel, an occurrence's stacktrace in the
Errors view, or a profile frame whose file the profiler recorded — a
View source control fetches the lines around that frame from the
tenant's linked GitHub repositories (POST
/api/v1/tenants/{id}/source-context) and shows them inline, naming the
repository and the ref they came from; when the telemetry carries no
commit, the repository's default branch is read and the snippet is
labelled as unpinned. Frames whose file cannot be read from the
stacktrace text, and frames whose source GitHub cannot serve, simply show
no snippet. The control appears only when the tenant has linked at least
one repository (see below).
GitHub (/integrations/github)
Tenant-admin-only page (Settings → Integrations) for connecting SignalDB's GitHub App to the
repositories that produce the tenant's telemetry. Connect GitHub asks
the server for an install URL (POST
/api/v1/tenants/{id}/github-installations/link) and sends the
browser to GitHub's install page; after you pick an organization and
repositories, GitHub brings you back to this page, which shows the linked
installation with the repositories it covers, who linked it, a Manage on
GitHub link, and a Remove action. The list refreshes each
installation's repositories from GitHub on every load and marks an entry
stale when GitHub could not be reached. When the operator has not
configured the [github] section, the page explains that instead of
offering Connect. Next to Connect GitHub, and visible only to an
instance admin (a tenant admin who is not also an instance admin does not
see it, since the endpoint rejects that credential), a Link existing
installation field takes a numeric installation id and attaches it
directly (POST .../github-installations/attach), with no OAuth redirect —
this is the way to link a second tenant to a GitHub account that already
has the App installed, since GitHub then skips the consent screen and
Connect GitHub has nothing to complete. Operator setup and the security
model: Connecting GitHub.
API keys (/api-keys)
Tenant-admin-only page (Settings → API keys) and the one place API keys
are created, scoped, edited and revoked, through the generated management
client (listApiKeys, createApiKey, updateApiKey, revokeApiKey),
scoped to the current tenant.
Every key carries explicit scopes chosen in a picker grouped into
Ingestion (metrics:write, logs:write, traces:write,
profiles:write — all four checked by default, since a key missing any of
them 403s on that signal's OTLP ingest), Schema (schema:read,
schema:write), Evals (evals:read, evals:write — reading and
managing eval sets), and Management (tenant:manage — lets the key manage
this tenant's datasets, keys, and members through the same management API
this page uses; see Authentication),
each with a one-line description; at least one scope is required, and an
optional dataset restriction can be set. The list shows each key's scopes,
and Edit scopes on a live key changes them in place (via
PATCH /api/v1/tenants/{id}/api-keys/{key_id}) without rotating
the secret; the change applies to the key's next request.
Creating a key shows the secret once in a modal with a copy button; revoking is immediate and irreversible, and revoked keys cannot be edited.
Send data (/instrumentation)
Guided, source-specific instructions for sending telemetry to SignalDB. A sidebar lets the user pick one of six sources:
| Source | Snippet type |
|---|---|
| OTel SDK | OTEL_EXPORTER_OTLP_* env vars |
| OTel Collector | YAML exporter config |
| Kubernetes | Helm values / kubectl manifest |
| Docker | docker run / compose env vars |
| journald | Promtail config |
| Prometheus | remote_write config |
Every snippet is interpolated directly from GET /api/v1/connection —
tenant ID, dataset ID, headers, and endpoints all come from that one
response, so a snippet reflects the deployment's real public-facing host,
port, and TLS setting — honoring [public] in signaldb.toml — rather than
guessing from the browser's own hostname; a callout above the snippets flags
when [public] is unset and the reported URLs are localhost fallbacks. If
the request itself fails, the page never falls back to a guessed snippet:
a 401 redirects to /login?redirect=..., a 403 shows that the
current tenant does not grant access to connection details (no retry, since
retrying cannot change that), and any other failure — a 429, a network
error — shows an error message with a retry button.
A Verification section at the bottom answers whether data is actually arriving: one row per signal (traces, logs, metrics, profiles) counts that signal's records over the last 15 minutes through the Query IR and reads "Receiving (N in the last 15 min)" or "Waiting for data". The rows re-poll every ten seconds while the page is open, so a visitor who has just wired up a collector sees the row flip without reloading.
Schema hub (/schema)
Two tabs, each a real URL so the browser back button walks between views:
- Conventions (
/schema/conventions, every tenant user) — the semantic-convention registries visible to the tenant: the bundledotel,otel-genai, andsignaldbregistries (read-only, marked with a lock) plus any custom registries, with version, source, definition counts, and last update. A precedence line shows the order lookups use (custom first). The lookup box resolves an attribute key, entity name, or metric name across all registries and lists every hit in precedence order, the first marked primary. Opening a registry (/schema/conventions/<namespace>/<version>) shows a browser with a filter box over its attributes, entities, and metrics and a definition pane; each definition has its own URL (…/attributes/<key>,…/entities/<name>,…/metrics/<name>) and links to alternatives defined in other registries. - Storage (
/schema/storage, instance admins only) — the logical (query-facing) field model and the resolved physical storage schema per signal source, as before.
Processors (/processors)
Lists the tenant's OTTL telemetry processors: name, signal,
dataset, enabled state, priority, status (ok/invalid), and last update, a
disabled processor visually distinct from an enabled one. Tenant admins can
create, edit, enable/disable, and delete processors here; other members see
the page read-only. The editor takes name, description, signal, a dataset
picker (the tenant's datasets, plus "all datasets"), enabled, priority, error
mode, and statements (one per line); on blur, or an explicit Validate
action, it calls :validate and annotates each failing line with its
message and column — Save is disabled while any error is present. A
Test panel, preloaded with a sample OTLP JSON payload for the selected
signal and editable, submits the current (unsaved) processor to :test and
renders a before/after diff of the payload plus per-statement match and
error counts. Both sides of the diff list keys alphabetically and leave out
zero-valued fields, so only what the statements changed shows up. After a successful save the editor shows an "applies within
N seconds" hint, matching [processors].reload_interval. Everything goes
through the generated TypeScript client.
Tenant admins also get New / Upload registry on the Conventions tab and Edit on custom registries: a source editor over the Weaver-format YAML or JSON document with server-side Validate (per-path errors and resulting counts), Save / Replace (blocked until validation passes), Save as new version, a summary of added, changed, and removed definitions against the stored document, and Delete with confirmation. Bundled registries never expose these actions. Unsaved edits are guarded everywhere: any in-app navigation away from a dirty form (the editor's crumb links, the sidebar, the command palette, browser Back or Forward) opens an "Unsaved changes" dialog with Stay and Leave, and reload or tab close still gets the browser's own warning. The same guard covers the API-key form, the consent dialog and the allowed-origins picker, since they register as dirty forms too. A successful Save, Save as new version or Delete leaves the editor without a prompt: once the document is stored there is nothing unsaved to protect.
Throttling and retries
Every request the UI makes goes through one retrying fetch shared with the
generated API client (see client retry): a 429 from the
tenant's query rate limit is retried after the server-stated Retry-After
when the response carries one, or a jittered backoff otherwise (idempotent
transient failures too): retries absorb a brief burst while the bounded
retry budget lasts, so it usually doesn't flash an error. While a retry
is pending the panel keeps loading and a thin banner under the
page header reads "Some requests are being retried after throttling…"; leaving the
page or superseding the query cancels the wait. Once the retry budget is
spent, the panel's error reads Rate limited — server asked to retry in N s
rather than a generic failure. A request that hangs rather than failing
outright is bounded by its own client-side timeout, sooner than the backend's,
so a stuck panel eventually shows an error instead of loading forever (see
client retry).
Updates
The UI is an installable web app that keeps a cached copy of itself, and it checks for a new build when it loads and every hour while the tab is visible. A new build downloads in the background and waits: a "A new version is ready" banner with Reload appears across the top of every page, including sign-in and the error screen, and the update also applies itself on your next navigation as long as no form has unsaved edits. A plain browser reload does not switch versions while the new build waits; closing every tab of the app does.
If a page crashes, the "Something went wrong" screen checks for a new build straight away and switches to it as soon as it is ready, since an outdated cached build is a common cause and a crashed page has no unsaved edits to lose.
Opening or reloading the UI asks the server first. The cached copy is only used when the server doesn't answer within about 5 seconds, for example while you are offline.
If a reverse proxy with its own login (Pangolin, Authelia, oauth2-proxy) sits in front of SignalDB, an expired proxy session makes the proxy redirect the UI's data requests to its login page. The browser blocks those redirects, so panels fail with network errors. The UI spots this, reloads the page once, and the proxy shows its login page; after you sign in you land back in the UI, and the update check can find new builds again. The UI won't reload a second time until a request gets through, so it can't loop.
Availability
Container images (router and monolithic) ship the UI preinstalled. For
source builds, the router serves the directory named by SIGNALDB_UI_DIR:
pnpm install && pnpm ui:build          # builds src/ui/dist
SIGNALDB_UI_DIR=src/ui/dist cargo run --bin signaldb
Without SIGNALDB_UI_DIR, the root serves a placeholder page. Setting the
variable to a directory without a built UI fails startup on purpose — a
misconfigured deployment should not silently ship without its UI.
The UI is installable as a PWA — "Add to Home Screen" on mobile, an install prompt in desktop Chrome/Edge — giving it its own window and icon instead of a browser tab. Only the app shell (JS/CSS/HTML, icons, manifest) is cached for offline/instant loading; every query and every telemetry request always goes to the network, never the cache, so an installed instance can't show stale investigation data. A new build installs in the background — including in a tab left open for days, since it re-checks for updates hourly rather than only on navigation — and then waits rather than reloading underneath the user: a small banner offers Reload to switch now, and otherwise the update applies itself on the next in-app navigation once no form (a schema registry edit, an API-key form, the consent dialog, the origin picker) has unsaved input, so a half-typed change is never lost to a deploy.
Telemetry
The UI is instrumented with OpenTelemetry (browser SDK) across two signal
types. Spans: it injects a W3C traceparent into every API call so a user
action correlates end-to-end with the backend traces it triggers, and stamps
every span with a RUM session.id plus the active tenant.id / dataset.id.
The initial page load is correlated in the reverse direction: the router
injects the server's trace context directly into index.html as a
<meta name="traceparent"> tag, and the UI uses it as the real parent of its
documentLoad span (falling back to a same-trace-id link, read from the
response's Server-Timing: traceparent entry,
when no tag is present). See Trace context in the document
body for the
sampling trade-off that comes with real parenting.
Log records: Core Web Vitals, navigation/resource timing, route changes,
uncaught errors, console error/warn calls, and clicks are captured as log
records via @opentelemetry/browser-instrumentation, stamped with the same
session.id/tenant.id/dataset.id plus url.template, the active route's
pattern (/traces/:traceId, never a concrete id). Clicks record the target's
CSS selector and tag name, never its text or an input's value. Browser errors
show up here (not as browser.error spans — that hand-rolled span capture was
replaced by this). A render error React Router's own error boundary catches —
one that never reaches window's error event, so the instrumentation above
can't see it — is recorded the same way: the root route's errorElement emits
one exception log record (type, message, stacktrace, plus the route's URL)
and shows a fallback with Reload / Go home actions instead of the
router's bare default.
The UI's resource also carries service.namespace, signaldb.server.version
(the backend build that served the session — distinct from the UI bundle's
own service.version), deployment.environment.name, and browser identity
(user_agent.original, plus browser.brands/browser.platform on Chromium).
Full instrumentation list and rationale in the frontend-instrumentation
skill.
Export is opt-in. The preferred way to turn it on is the
[self_monitoring.frontend] config section — the router serves it to the
browser at runtime, so one image works for every deployment without a rebuild:
[self_monitoring.frontend]
enabled = true
endpoint = "http://signaldb.example:4318"   # reachable from the browser; both /v1/traces and /v1/logs
api_key = "sk-ingest-only-key"               # world-readable; ingest-only
# tenant_id / dataset_id default to _system / _monitoring
The api_key is delivered to the browser and is visible to anyone who can load
the UI, so use an ingest-only key and only on a trusted network; CORS for
its origin is controlled per-key via allowed_origins on the API key itself
(see Authentication),
not by a setting here. When the
UI is internet-facing, point endpoint at an OTLP collector that adds
auth/tenant headers and scrubs PII instead of straight at the acceptor. With
export unset, propagation still works and dev builds print spans to the
console. (A build-time SIGNALDB_OTLP_ENDPOINT is still honoured as a
fallback.) Contributor detail lives in the frontend-instrumentation skill.
Developing the UI
See src/ui/README.md: pnpm ui:dev runs a Vite
dev server with hot reload that proxies API calls to any live SignalDB
instance (local or remote) with credentials injected from .env.local.
Components and pages have Storybook stories (pnpm --filter signaldb-ui
storybook), which also feed the Claude Design design system via
design-sync. A new page ships with a Pages/<Name> story (light and dark,
fixtures derived from each request's own time range) and an entry in
.design-sync/pkg/build.sh and .design-sync/config.json.
The UI talks to the API only through the generated TypeScript client in
src/ui/src/api/gen/ (regenerated with cargo xtask generate whenever the
OpenAPI document changes); it covers every router endpoint, including the
schema registry operations the semantic attribute labels
and the Schema hub are built on.